HQ: Bishramganj
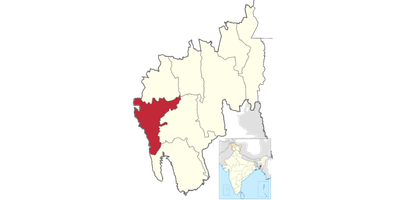
Sepahijala District
15
SDG Goals Covered
62
Indicators with Data
2024
Latest Reporting Year
Bishramganj
Headquarters
SDG Data Overview — Sepahijala
Approved observations visualised by year and goal.
Year-wise Trend
Observations reported per year — Sepahijala
Score Band Distribution
NITI Aayog — latest year per indicator
Achiever: 27
Frontrunner: 2
Performer: 9
Aspirant: 20
No Score: 4
Goal-wise Yearly Performance (Bar Graph)
Average score of all indicators reported under each SDG Goal
2019
2020
2022
2023
2024
Indicator-wise Yearly Performance
Normalized score (0-100) and band designation for each indicator
| Code | Indicator Name | 2019 | 2020 | 2022 | 2023 | 2024 |
|---|---|---|---|---|---|---|
| IND-001 | Percentage of beneficiaries covered under NFSA |
100.0
Achiever
|
100.0
Achiever
|
— |
100.0
Achiever
|
— |
| IND-002 | Persons provided employment as a percentage of persons who demanded employment under MGNREGA | — | — | — |
100.0
Achiever
|
— |
| IND-003 | Percentage of Self-Help Groups (SHGs) provided credit linkage |
0.0
Aspirant
|
— |
7.9
Aspirant
|
5.3
Aspirant
|
— |
| IND-004 | Percentage of women receiving benefits under PMMVY or any other maternity related State schemes against target |
100.0
Achiever
|
100.0
Achiever
|
— |
28.4
Aspirant
|
— |
| IND-005 | Percentage of affordable houses completed against sanctioned (rural +urban) under PMAY and related State schemes |
0.0
Aspirant
|
100.0
Achiever
|
— |
61.2
Performer
|
— |
| IND-006 | Hospital beds empaneled under PMJAY or related State schemes per 10,000 eligible population | — | — | — |
0.0
Aspirant
|
— |
| IND-044 | Percentage of women representatives in PRIs, ULBs, District Autonomous Councils, VCs, VECs |
4.6
Aspirant
|
— |
100.0
Achiever
|
3.9
Aspirant
|
— |
| IND-045 | Women provided employment as a percentage of total employment demanded by women under MGNREGA |
54.5
Performer
|
100.0
Achiever
|
— |
100.0
Achiever
|
— |
| IND-046 | Persons with Disability (PWDs) provided employment as a percentage of total employment demanded by PWDs under MGNREGA | — |
100.0
Achiever
|
— |
100.0
Achiever
|
— |
| IND-048 | Houses completed under Pradhan Mantri Awas Yojana (PMAY) and/or other schemes as a percentage of net demand assessment (Urban) | — |
24.1
Aspirant
|
— |
100.0
Achiever
|
— |
| IND-049 | Deaths due to road accidents per 1,00,000 population | — |
100.0
Achiever
|
— |
84.5
Achiever
|
— |
| IND-050 | Percentage of wards with waste collection |
100.0
Achiever
|
100.0
Achiever
|
— |
100.0
Achiever
|
— |
| IND-051 | Percentage of individual household toilets constructed against target (SBM(U)) |
65.4
Frontrunner
|
65.9
Frontrunner
|
— | — | — |
| IND-052 | Percentage of Municipal Solid Waste (MSW) treated out of total MSW generated |
0.1
Aspirant
|
0.1
Aspirant
|
— |
100.0
Achiever
|
— |
| IND-053 | Area under jhum cultivation as a percentage of total area under agriculture |
97.8
Achiever
|
97.0
Achiever
|
— |
95.6
Achiever
|
— |
| IND-054 | Percentage of area under micro/minor irrigation in the district |
10.9
Aspirant
|
10.9
Aspirant
|
— |
0.0
Aspirant
|
— |
| IND-055 | Plastic waste generated per 10,000 population (Tonnes/Annum) | — |
0.0
Aspirant
|
— |
80.4
Achiever
|
— |
| IND-056 | Number of human lives lost due to natural calamity per 10,000 population | — |
39.1
Aspirant
|
— |
61.3
Performer
|
— |
| IND-057 | Area under watershed management as a percentage of total geographical area | — |
100.0
Achiever
|
— |
100.0
Achiever
|
— |
| IND-058 | Number of wildlife crime cases reported per 1,000 sq kms of forest area | — |
68.8
Frontrunner
|
— |
100.0
Achiever
|
— |
| IND-059 | Reported murders per 10,000 population | — |
61.3
Performer
|
— |
53.1
Performer
|
— |
| IND-060 | Cognizable crimes against children per 10,000 population | — |
61.4
Performer
|
— |
73.1
Frontrunner
|
— |
| IND-061 | Number of missing children per 10,000 population | — |
55.5
Performer
|
— | — | — |
| IND-062 | Ratio of working strength to sanctioned strength of Judges (District & Subordinate courts) |
50.0
Performer
|
— |
29.6
Aspirant
|
44.4
Aspirant
|
— |
| IND-063 | Common Service Centres providing online services per 10,000 population | — | — |
24.4
Aspirant
|
25.7
Aspirant
|
— |
| IND-007 | Percentage of Fair Price Shops (FPS) covered under online transaction system for PDS in the district |
100.0
Achiever
|
— |
100.0
Achiever
|
100.0
Achiever
|
— |
| IND-008 | Percentage of anganwadi centres in the district with anthropometric measurement devices (height, weight measurement) |
100.0
Achiever
|
— |
100.0
Achiever
|
100.0
Achiever
|
— |
| IND-009 | Percentage of anganwadis with own buildings |
79.4
Frontrunner
|
— |
78.2
Frontrunner
|
52.3
Performer
|
— |
| IND-010 | Average yield of rice (kg/ha) |
40.1
Aspirant
|
0.0
Aspirant
|
— |
49.9
Aspirant
|
— |
| IND-011 | Productivity of fruits and vegetables (kg/ha) |
25.4
Aspirant
|
0.0
Aspirant
|
— |
51.4
Performer
|
— |
| IND-012 | Percentage of pregnant women who completed 4 ANCs in the district | — | — | — |
33.3
Aspirant
|
— |
| IND-013 | Percentage of births attended by skilled health personnel |
74.9
Frontrunner
|
— | — |
0.0
Aspirant
|
— |
| IND-014 | Percentage of children aged 9-11 months fully immunized |
0.0
Aspirant
|
72.2
Frontrunner
|
— |
100.0
Achiever
|
— |
| IND-015 | Infant Mortality Rate |
100.0
Achiever
|
— | — |
100.0
Achiever
|
— |
| IND-016 | Number of functional new born facilities (SNCU, NBSU, NBCC) per 10,000 population | — | — | — | — | — |
| IND-017 | Number of new HIV infections per 1,000 uninfected population | — |
90.4
Achiever
|
— |
74.6
Frontrunner
|
— |
| IND-018 | Percentage of TB cases successfully treated among TB cases notified to the national health authorities |
0.0
Aspirant
|
100.0
Achiever
|
— |
100.0
Achiever
|
— |
| IND-019 | Number of suicide deaths reported per 1,00,000 population | — |
48.1
Aspirant
|
— |
40.3
Aspirant
|
— |
| IND-020 | Number of de-addiction centres (public and private) per 1,00,000 population | — | — |
0.0
Aspirant
|
0.0
Aspirant
|
— |
| IND-021 | First Referral Units (FRUs) per 1,00,000 population | — | — |
0.0
Aspirant
|
4.1
Aspirant
|
— |
| IND-022 | Total physicians, nurses and midwives per 10,000 population | — | — |
1.7
Aspirant
|
4.5
Aspirant
|
— |
| IND-023 | Average annual drop-out rate at secondary level (Class 9-10) |
0.0
Aspirant
|
8.2
Aspirant
|
— | — | — |
| IND-024 | Ratio of female to male enrolment at secondary level (Class 9-10) | — |
100.0
Achiever
|
— |
100.0
Achiever
|
— |
| IND-025 | Percentage of schools with computers available |
4.6
Aspirant
|
9.8
Aspirant
|
— |
30.7
Aspirant
|
— |
| IND-026 | Percentage of schools with access to electricity |
3.3
Aspirant
|
3.7
Aspirant
|
— |
32.6
Aspirant
|
— |
| IND-027a | Percentage of trained teachers at secondary level (Class 9-10) |
100.0
Achiever
|
100.0
Achiever
|
— | — | — |
| IND-028 | Crimes against women per 10,000 female population | — |
50.0
Aspirant
|
— |
59.0
Performer
|
— |
| IND-029 | Percentage of sexual crimes against women to total crimes against women |
32.4
Aspirant
|
51.3
Performer
|
— |
52.6
Performer
|
— |
| IND-030 | Exclusive women SHGs in bank linked SHGs |
0.0
Aspirant
|
8.0
Aspirant
|
— |
100.0
Achiever
|
— |
| IND-031 | Toilets constructed against target - SBM(G) |
68.2
Frontrunner
|
89.7
Achiever
|
— |
40.6
Aspirant
|
— |
| IND-032 | Percentage of schools with functional toilet facility for girls | — | — | — |
28.0
Aspirant
|
— |
| IND-033 | Percentage of GPs/Villages verified as ODF in the district |
100.0
Achiever
|
— |
100.0
Achiever
|
100.0
Achiever
|
— |
| IND-034 | Percentage of villages/GPs electrified |
100.0
Achiever
|
— |
100.0
Achiever
|
100.0
Achiever
|
— |
| IND-035 | Percentage of loans disbursed to MSMEs against sanctioned | — |
36.7
Aspirant
|
— |
63.3
Performer
|
— |
| IND-036 | Number of victims of human trafficking per 10,000 population | — |
100.0
Achiever
|
— |
100.0
Achiever
|
— |
| IND-037 | Number of bank branches including Business Correspondents (BCs) in Urban, Semi-urban and Rural areas per 10,000 population | — | — |
0.0
Aspirant
|
100.0
Achiever
|
— |
| IND-038 | Automated Teller Machines (ATMs) per 10,000 population | — | — |
1.7
Aspirant
|
0.0
Aspirant
|
— |
| IND-039 | Percentage of women account holders in PMJDY |
100.0
Achiever
|
— |
100.0
Achiever
|
100.0
Achiever
|
— |
| IND-040 | Percentage of habitations with access to all weather roads under PMGSY and other State schemes |
97.0
Achiever
|
— |
96.4
Achiever
|
100.0
Achiever
|
— |
| IND-041 | Surfaced road as a percentage of total road length |
65.0
Frontrunner
|
— |
56.5
Performer
|
59.4
Performer
|
— |
| IND-042 | Percentage of GPs/villages with internet connection (broadband or cellular) | — | — | — |
87.2
Achiever
|
— |
| IND-043 | Percentage of villages covered by a mobile network |
92.9
Achiever
|
— |
91.8
Achiever
|
100.0
Achiever
|
— |
Individual Indicator scores are normalized from 0-100 following NITI Aayog guidelines.
Goal-wise Yearly Performance
Average score of all indicators reported under each SDG Goal
| SDG Goal | 2019 | 2020 | 2022 | 2023 | 2024 |
|---|---|---|---|---|---|
|
SDG-01
No Poverty
|
50.0
Performer
|
100.0
Achiever
|
7.9
Aspirant
|
49.2
Aspirant
|
— |
|
SDG-02
Zero Hunger
|
69.0
Frontrunner
|
0.0
Aspirant
|
92.7
Achiever
|
70.7
Frontrunner
|
— |
|
SDG-03
Good Health and Well-Being
|
43.7
Aspirant
|
77.7
Frontrunner
|
0.6
Aspirant
|
45.7
Aspirant
|
— |
|
SDG-04
Quality Education
|
27.0
Aspirant
|
44.3
Aspirant
|
— |
54.4
Performer
|
— |
|
SDG-05
Gender Equality
|
16.2
Aspirant
|
36.4
Aspirant
|
— |
70.5
Frontrunner
|
— |
|
SDG-06
Clean Water and Sanitation
|
84.1
Achiever
|
89.7
Achiever
|
100.0
Achiever
|
56.2
Performer
|
— |
|
SDG-07
Affordable and Clean Energy
|
100.0
Achiever
|
— |
100.0
Achiever
|
100.0
Achiever
|
— |
|
100.0
Achiever
|
68.4
Frontrunner
|
33.9
Aspirant
|
72.7
Frontrunner
|
— | |
|
85.0
Achiever
|
— |
81.6
Achiever
|
86.7
Achiever
|
— | |
|
SDG-10
Reduced Inequalities
|
29.5
Aspirant
|
100.0
Achiever
|
100.0
Achiever
|
68.0
Frontrunner
|
— |
|
55.2
Performer
|
58.0
Performer
|
— |
96.1
Achiever
|
— | |
|
54.3
Performer
|
36.0
Aspirant
|
— |
58.7
Performer
|
— | |
|
SDG-13
Climate Action
|
— |
69.6
Frontrunner
|
— |
80.7
Achiever
|
— |
|
SDG-15
Life on Land
|
— |
68.8
Frontrunner
|
— |
100.0
Achiever
|
— |
|
50.0
Performer
|
59.4
Performer
|
27.0
Aspirant
|
49.1
Aspirant
|
— |
Scores are the arithmetic mean of the normalized scores (0-100) of the indicators covered under each goal for a given year.
Explore Other Districts
Districts of Tripura
SDG monitoring spans all districts — tracking progress from headquarters to grassroots.
TRIPURA
#05
Sepahijala Current
Bishramganj
Currently Viewing